How to Calculate and Reduce Your Cost Per Qualified Lead
This article covers how to calculate CPQL correctly so the number actually means something, what realistic 2026 benchmarks look like by industry and channel, and the specific tactics that move the number down without gutting your lead volume.
Most paid media teams track cost per lead, celebrate when the number drops, and then spend the next quarter wondering why the pipeline is empty. It's a pattern we see consistently across insurance, financial services, and regulated B2B verticals. The metric they're missing is cost per qualified lead (CPQL): the most directly relevant number for connecting ad spend to revenue-ready opportunities. In pipeline audits across insurance agencies and financial services firms running five-figure monthly ad budgets, a recurring finding is that the real CPQL runs 2, 3x higher than what the dashboard shows, consistent with what industry practitioners report broadly. The raw lead number looks healthy. The qualified pipeline does not.
This article covers how to calculate CPQL correctly so the number actually means something, what realistic 2026 benchmarks look like by industry and channel, and the specific tactics that move the number down without gutting your lead volume.
Why Cost Per Lead Is a Misleading Number
CPL and CPQL measure fundamentally different things. CPL counts anyone who submitted a form. CPQL counts only the prospects who meet defined sales criteria, meaning they have the right budget, authority, need, and timeline to actually buy. The gap between those two numbers is where most marketing budgets bleed out.
Run this scenario: two campaigns, same $5,000 spend. Campaign A generates 50 leads at $100 CPL. Campaign B generates 20 leads at $250 CPL. If Campaign A qualifies at 10% and Campaign B qualifies at 40%, Campaign A's real CPQL is $1,000. Campaign B's is $625. The "cheaper" campaign costs 60% more where it counts.
The Real Cost of Optimizing for the Wrong Metric
When teams optimize for CPL, they train ad algorithms to chase volume over quality. On Meta especially, this means form fills from job seekers, students, and out-of-market browsers with no intent to buy, a dynamic that's well-documented in paid social audits across regulated verticals. Sales teams get flooded with low-intent leads, follow-up rates drop, and marketing takes the blame for a pipeline problem that started with the wrong metric. Across insurance and financial services accounts, CPQL typically runs 2, 3x higher than CPL because only 30, 50% of raw leads meet qualification criteria.
The downstream effect compounds fast. When reps spend time disqualifying bad leads instead of closing good ones, close rates fall and sales leadership starts demanding "better leads." The real fix is upstream, not a personnel problem at all.
When CPL Is Still a Useful Signal
CPL isn't useless. It's just incomplete. It functions as an early-funnel health check, telling you whether your creative and landing page are generating any response at all. Use CPL to monitor top-of-funnel friction and creative fatigue. Use CPQL to evaluate whether that funnel is actually delivering revenue-ready opportunities. The mistake isn't tracking CPL, it's stopping there.
Cost Per Qualified Lead: How to Calculate a Fully Loaded CPQL
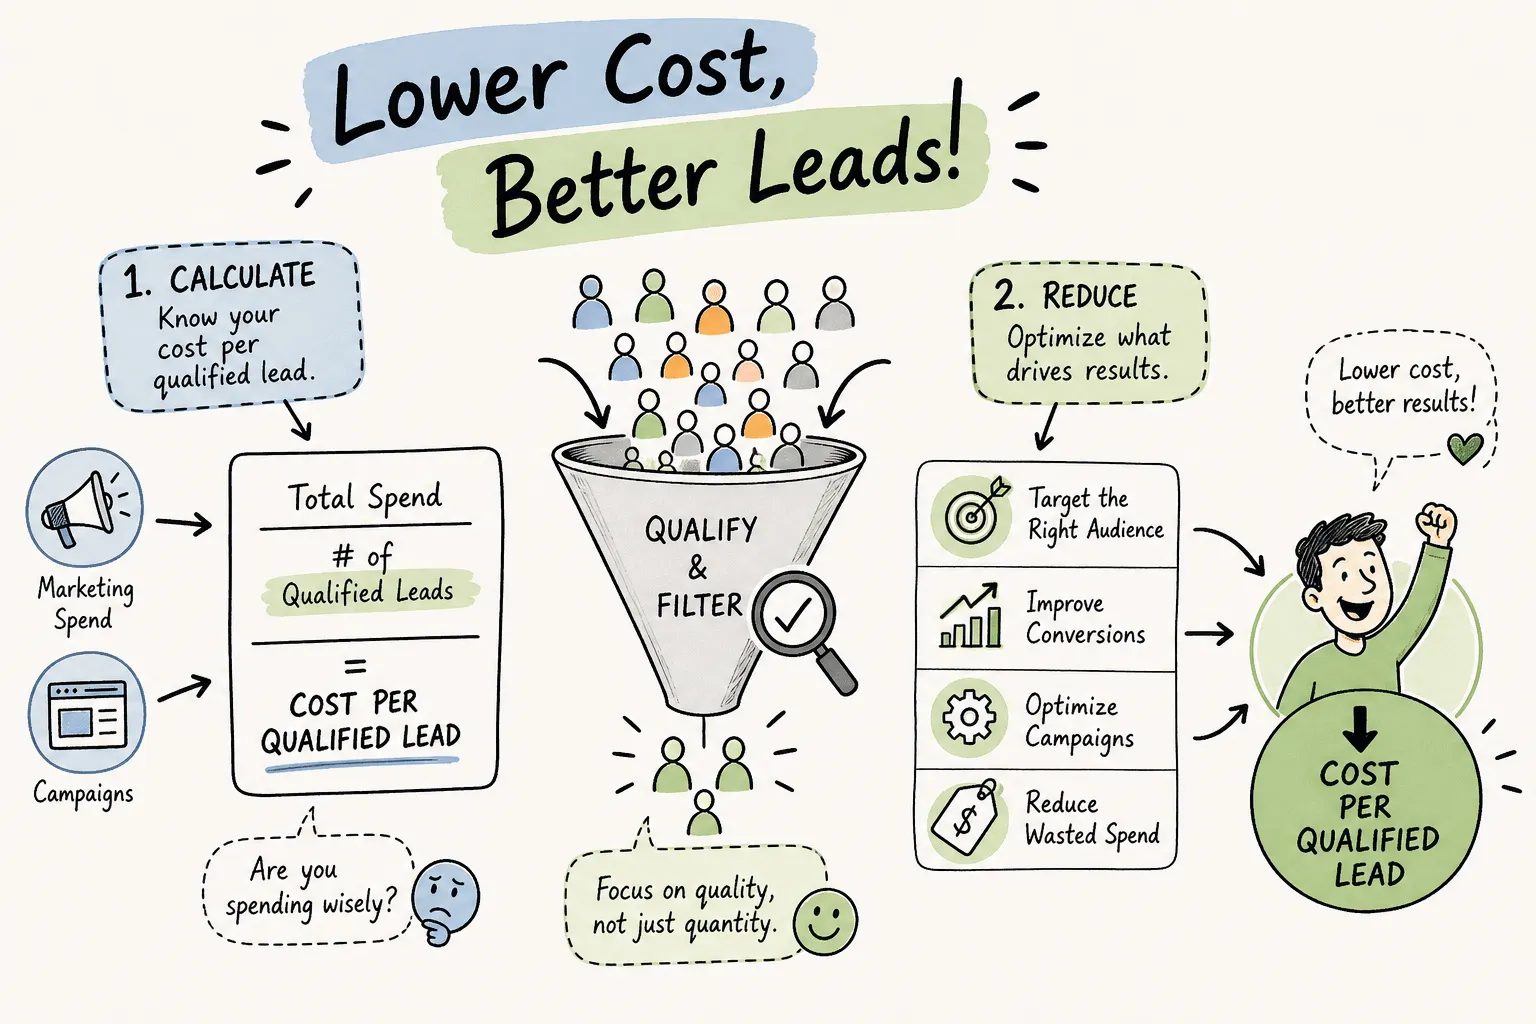
The formula is straightforward: CPQL = Total Marketing Spend ÷ Number of Qualified Leads. Where teams consistently go wrong is in the numerator. Most calculations only count media spend, which produces an artificially low CPQL that flatters the marketing team but doesn't reflect reality.
A fully loaded CPQL includes paid media, agency retainers, platform and automation tool costs (CRM, attribution software, lead routing), creative production, and the allocated time of any SDR or marketing ops staff dedicated to top-of-funnel work. If your attribution software costs $400 per month and your SDR spends 40% of their time on inbound lead handling, those costs belong in the numerator.
Building an Accurate Numerator
Knowing what to include, and what to leave out, is where most CPQL calculations break down. Use the two categories below to structure your numerator correctly:
Include:
-
Paid media spend across all active channels
-
Platform and automation tool subscriptions (CRM, attribution, lead routing)
-
Creative and content production tied to lead generation
-
Agency retainers
-
Allocated personnel costs for anyone working on top-of-funnel activities
Exclude:
-
Post-sale support costs
-
General company overhead with no direct connection to lead generation
-
Spend on channels that have never produced a qualified lead
Blending dead channels into the numerator inflates CPQL for your productive channels and obscures what's actually working.
Choosing the Right Denominator: MQL, SQL, or Customer
The denominator determines how trustworthy your CPQL is. Your options are MQL (marketing-qualified, based on fit and engagement scoring), SQL (sales-accepted, confirmed via BANT or equivalent criteria), and customer (the most accurate, but slowest feedback loop). For most B2B teams in regulated industries, SQL is the right denominator because MQL counts are easy to game with loose scoring thresholds.
A concrete example makes this clear. For an insurance agency, an MQL might be anyone who fills out a quote request form. An SQL is a prospect who has confirmed they're reviewing their coverage, has decision-making authority, and can bind coverage within 30, 60 days. For a financial advisory firm, an MQL might be anyone who attends a webinar; an SQL is a prospect with investable assets above the minimum threshold who has agreed to a discovery call. The tighter your SQL definition, the more honest your cost per qualified lead becomes.
2026 Cost Per Qualified Lead Benchmarks by Industry and Channel
Published benchmark data reports CPL, not CPQL. To estimate your cost per qualified lead, divide the CPL benchmark for your channel by your internal qualification rate. If your qualification rate is 15% and your paid CPL is $380, your CPQL is approximately $2,533. That math should drive your budget planning, not the CPL figure alone. These CPL reference points are drawn from industry benchmark compilations for 2026 including WordStream, HubSpot, and Ruler Analytics data.
What Cost Per Qualified Lead Looks Like by Channel
Channel selection drives a large portion of CPQL variance. Here's how the major channels compare on CPL, with the CPQL implication for B2B regulated verticals:
-
Referrals: roughly $25 CPL, highest qualification rates, but not scalable as a primary channel
-
Paid search (Google): $165, $463 CPL depending on industry; high intent, competitive, and most reliable for CPQL in B2B
-
Paid social (Meta): approximately $142 CPL on average, but qualification rates in regulated B2B verticals typically sit at 5, 10%, which puts real CPQL in the range of $1,420, $2,840 for most accounts
-
LinkedIn: $250, $600+ CPL, but the highest lead-to-opportunity conversion rate in B2B
-
Events and trade shows: roughly $840 CPL, high trust, slow feedback loop
-
Organic SEO: approximately $206 CPL, compounds over time, and qualification rates tend to be stronger than paid social
The core insight: the cheapest channel by CPL often produces the worst cost per qualified lead in regulated B2B verticals. Meta's low CPL looks attractive until you apply a realistic 7% qualification rate, at that point, you're paying roughly $2,000 per qualified lead. Channel selection should be driven by CPQL, not lead acquisition cost alone.
Industry-Specific Benchmarks to Size Your Targets
Blended CPL benchmarks for 2026 show insurance at approximately $320, financial services at $653, real estate at $280, and B2B SaaS at $237. Apply your qualification rate to those numbers to get directional CPQL targets. As an illustration: a financial services firm with a 15% qualification rate and a $653 blended CPL is looking at roughly $4,350 per qualified lead. That number isn't a failure; it's the reality of the vertical. Knowing your true sales qualified lead cost lets you set honest pipeline targets and make informed budget decisions rather than chasing benchmark numbers built for different industries.
The Attribution Gaps That Silently Inflate Your CPQL
Even a perfectly constructed CPQL formula produces a wrong number if your attribution is broken. Three gaps cause the most damage across insurance, real estate, and financial services accounts.
Untracked Calls and Offline Conversions
Phone calls are often the highest-intent conversions in regulated industries, and most teams don't track them at the campaign level. When a prospect sees a Google ad, calls instead of filling out a form, and eventually closes, that deal typically gets attributed to "direct" or disappears from reporting entirely. The result: paid search looks more expensive than it actually is, and your CPQL calculation excludes some of your most qualified leads from the denominator. Without call tracking connected to campaign-level data, every cost per qualified lead you calculate is artificially inflated.
Untagged Sources and the "Direct Traffic" Black Hole
A significant share of what Google Analytics labels as direct traffic is actually misattributed paid or email traffic from campaigns missing proper UTM parameters. When prospects come through untagged landing pages, dark social shares, or email links with stripped UTMs, the source is lost. That spend still sits in your CPQL numerator, but the leads never get credited to any channel, making every paid channel look worse than it actually is. Sloppy UTM hygiene is one of the most preventable causes of inflated cost per qualified lead.
What Connected Attribution Actually Fixes
When ad spend, CRM pipeline data, call tracking, and offline conversions are connected in a single attribution layer, CPQL becomes a trustworthy number rather than an educated guess. This is the exact problem VELO's unified attribution dashboard is built to solve: tracing every qualified lead and closed deal back to the original ad source, campaign, and keyword. Without that layer, teams routinely cut high-CPQL campaigns that are actually producing the best qualified leads and scale low-CPL campaigns that generate noise. Getting attribution right is the prerequisite for every other optimization decision.
Proven Tactics to Lower Your Qualified Lead Cost
You don't lower CPQL by chasing the cheapest channel. You lower it by improving every input simultaneously: targeting precision, creative quality, funnel structure, and the data feedback loop into the ad platforms. Four compounding levers drive the biggest gains.
Fix Targeting Before Fixing Budget
Start with negative keyword expansion and audience exclusions before touching bids or budgets. On Google, separate transactional and informational query intent into distinct campaigns so you're not blending high-intent buyers with early researchers in the same bid strategy. On Meta, exclude segments that consistently fail qualification, job seekers, audiences in low-propensity zip codes, and competitor employee audiences. Tightening geography to your highest-conversion markets is a well-established tactic for reducing lead acquisition cost in local-service verticals like insurance and real estate, often producing measurable CPQL improvement within the first two to four weeks.
Feed Qualification Signals Back to the Ad Platforms
The highest-leverage tactic for sustained CPQL reduction is importing qualified lead or deal-won data from your CRM into Google Ads and Meta as custom conversion events, then letting Smart Bidding optimize for those signals. When the algorithm learns what a closed deal looks like, not just a form fill, it finds more of them. One VELO client in the financial services space reduced CPQL from $650 to under $120 after implementing CRM-to-platform conversion imports. The catch: you need at least 15 qualified conversions in 30 days for Smart Bidding to recalibrate effectively, so the first step is always improving volume before optimizing for quality.
Replace Static Forms With Multi-Step Qualification Funnels
Single-field or two-field forms attract every type of visitor with equal efficiency. Multi-step funnels that ask qualifying questions before requesting contact details pre-filter leads at the top of the funnel. A prospect who confirms they have $500,000 in investable assets or that they're currently reviewing their commercial coverage before submitting their email is already partially qualified. This approach doesn't always reduce total lead volume, but it consistently improves the qualified percentage, which is the only thing that actually moves cost per qualified lead down.
Start With the Number You Don't Have Yet
The framework here is straightforward: calculate CPQL correctly with fully loaded costs and the right denominator. Then benchmark against realistic 2026 industry figures rather than generic thresholds that don't apply to your vertical. Finally, fix attribution before assuming your channels are underperforming. Most teams skip that last step entirely, which means every optimization decision downstream is built on flawed data.
The biggest leverage point most teams miss is the attribution gap between ad click, CRM entry, call tracking, and closed deal. Those gaps are where CPQL numbers get inflated and budgets get cut from campaigns that are actually working. Solving attribution doesn't require rebuilding everything at once. It requires connecting the systems you already have.
If your team doesn't know its true cost per qualified lead today, that's the starting point. VELO offers a free 30-minute pipeline audit that identifies your highest-leverage gaps in attribution, targeting, and funnel structure, with a written roadmap delivered within 48 hours. Getting the number right is what makes every other budget and optimization decision defensible. Request your pipeline audit here.